
I've just finished reading the e-book Learning Python Data Visualization. Is an e-book that teaches you how to create fancy graphics for data visualization using Python. It does not teach you how to program in Python, but the short Python introduction and the step-by-step examples will allow even the non- Python programmer to start creating their own graphics. For the more advanced programmers, they can easily follow the examples and available libraries to extend them into scripts to automate their web charts creation or mass data analysis processing.
|
Still working on several things in parallel and not so much to show but since last post I've made several images to support my hometown club Rio Ave, by placing digital content on photos, as shown in these examples: I'm also preparing a workshop for 3D modelling with Blender, directed to jewelry production, for which these images serve as example. The objective is to learn how to model in Blender so that you can then send the models for 3D printing, or other production techniques and have your own personal and unique jewel, for example by sending to Shapeways.com . 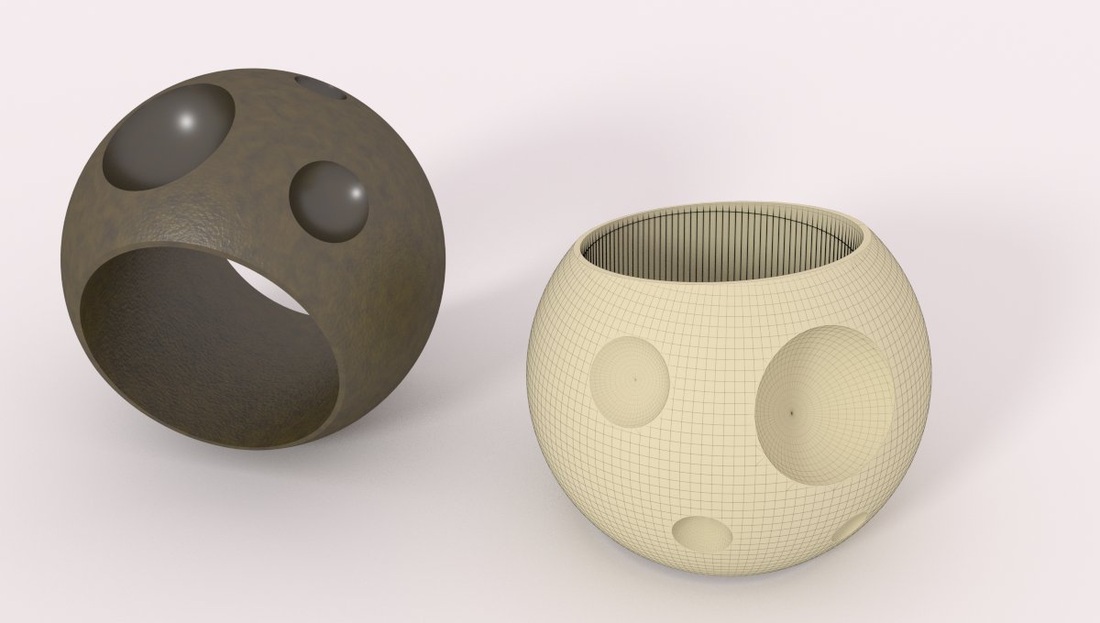 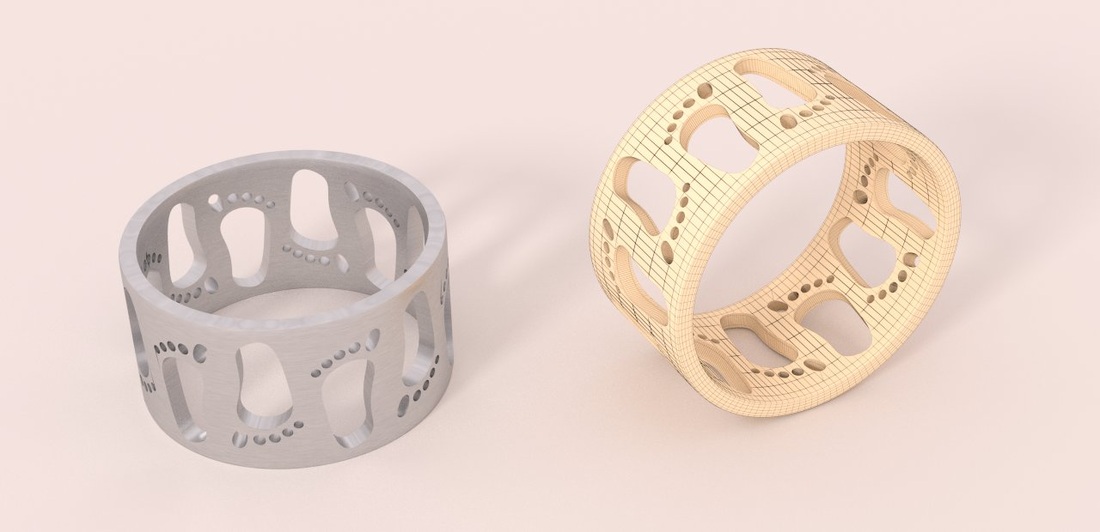 |
AuthorRenato Sousa Blog up to October 2012Archives
August 2016
Categories
All
|
 RSS Feed
